Average Directional Index (ADX): How to Measure Trend Strength
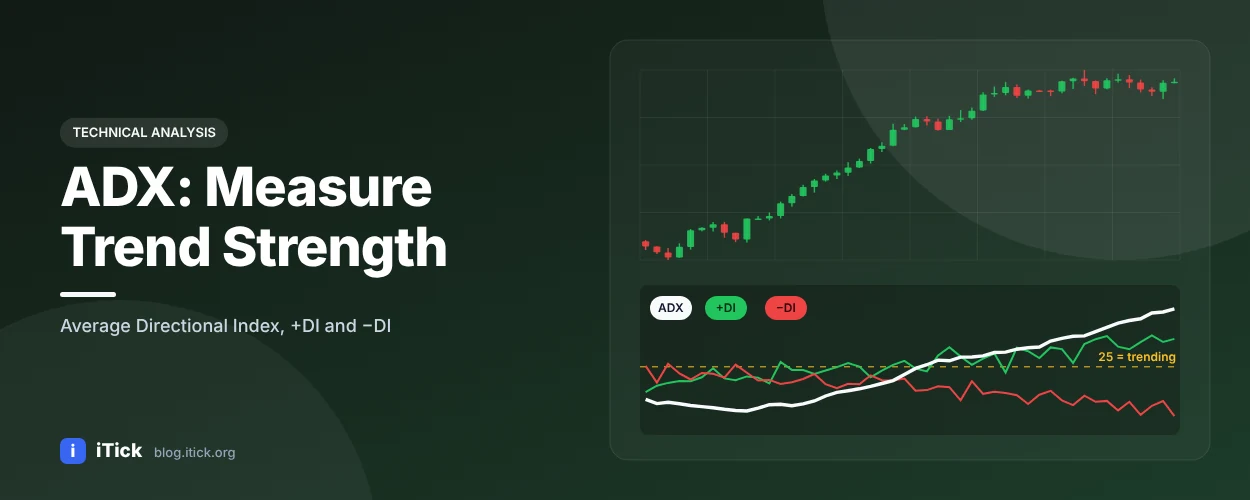
Average Directional Index (ADX): How to Measure Trend Strength
Most indicators tell you which way the market is moving. The Average Directional Index (ADX) answers a different and often more useful question: how strong is the trend? Developed by J. Welles Wilder in 1978, the ADX helps traders decide when to use trend-following strategies and when to stay out of choppy markets.
What the ADX measures
The ADX is part of Wilder's Directional Movement System, which has three lines:
- +DI (Positive Directional Indicator): strength of upward moves
- -DI (Negative Directional Indicator): strength of downward moves
- ADX: a smoothed average of the difference between +DI and -DI, showing trend strength regardless of direction
ADX ranges from 0 to 100. It does not tell you direction - a rising ADX can mean a strengthening uptrend or downtrend. Use +DI and -DI for direction.
How to read ADX values
| ADX value | Interpretation |
|---|---|
| Below 20 | Weak or no trend - range-bound market |
| 20 - 25 | Trend may be starting |
| 25 - 40 | Established trend |
| 40 - 50 | Strong trend |
| Above 50 | Very strong, possibly overextended trend |
These thresholds are guidelines, not laws. Many traders use ADX > 25 as the minimum to trade trend strategies.
ADX formula step by step (period N = 14)
- Directional movement for each bar:
- +DM = High_today − High_yesterday (if positive and greater than −DM, else 0)
- −DM = Low_yesterday − Low_today (if positive and greater than +DM, else 0)
- True Range (TR) = max(High − Low, |High − Close_prev|, |Low − Close_prev|)
- Smooth +DM, −DM and TR over N periods using Wilder's smoothing (an exponential average with α = 1/N).
- Directional indicators:
- +DI = 100 × smoothed(+DM) / smoothed(TR)
- −DI = 100 × smoothed(−DM) / smoothed(TR)
- DX = 100 × |+DI − −DI| / (+DI + −DI)
- ADX = Wilder-smoothed average of DX over N periods
ADX trading strategies
1. Trend filter. Only take moving-average or breakout signals when ADX is above 25. This simple rule removes many false signals in sideways markets.
2. DI crossover. When +DI crosses above −DI while ADX is rising above 20-25, it signals a potential long; the reverse signals a short.
3. Range strategy switch. When ADX falls below 20, switch from trend-following to mean-reversion tools such as RSI or the KDJ indicator.
4. Trend exhaustion. An ADX turning down from above 40-50 often means the trend is losing momentum - a cue to tighten stops rather than an automatic reversal signal.
Calculate ADX in Python
      import requests
import pandas as pd

TOKEN = "YOUR_API_TOKEN"
url = "https://api.itick.org/stock/kline"
params = {"region": "US", "code": "NVDA", "kType": 8, "limit": 400}
headers = {"accept": "application/json", "token": TOKEN}
df = pd.DataFrame(requests.get(url, params=params, headers=headers, timeout=10).json()["data"])
df = df.rename(columns={"h": "high", "l": "low", "c": "close"}).astype({"high": float, "low": float, "close": float})

def adx(df, n=14):
    up = df["high"].diff()
    down = -df["low"].diff()
    plus_dm = up.where((up > down) & (up > 0), 0.0)
    minus_dm = down.where((down > up) & (down > 0), 0.0)
    prev_close = df["close"].shift()
    tr = pd.concat([df["high"] - df["low"],
                    (df["high"] - prev_close).abs(),
                    (df["low"] - prev_close).abs()], axis=1).max(axis=1)
    wilder = lambda s: s.ewm(alpha=1 / n, adjust=False).mean()
    atr = wilder(tr)
    plus_di = 100 * wilder(plus_dm) / atr
    minus_di = 100 * wilder(minus_dm) / atr
    dx = 100 * (plus_di - minus_di).abs() / (plus_di + minus_di)
    return plus_di, minus_di, wilder(dx)

df["+di"], df["-di"], df["adx"] = adx(df)
df["trend"] = (df["adx"] > 25) & (df["+di"] > df["-di"])
print(df[["close", "+di", "-di", "adx", "trend"]].tail())
The OHLC data comes from the iTick historical data API; the same function works for forex pairs, gold, indices and crypto.
ADX limitations
- It is a lagging indicator built on several layers of smoothing.
- It says nothing about direction on its own.
- In very fast reversals ADX can stay high while price has already turned.
Treat ADX as a filter that improves other signals, not as a standalone system.
FAQ
What is a good ADX value? Above 25 generally indicates a tradable trend; below 20 suggests a range.
What period should I use? Wilder's original 14 periods is the standard. Shorter periods react faster but are noisier.
Is ADX a leading or lagging indicator? Lagging - it confirms trend strength after the trend has started.
Power your indicators with reliable data
Accurate highs, lows and closes are essential for true range and ADX. Get a free iTick API key for global stock, forex, futures and crypto OHLCV data.